| assets | ||
| css | ||
| .gitignore | ||
| data.json | ||
| index.html | ||
| main.js | ||
| package-lock.json | ||
| package.json | ||
| README.md | ||
| SubmissionNotes.md | ||
| vite.config.js | ||
Homework 4 - HOF and Functional Programming
General Description
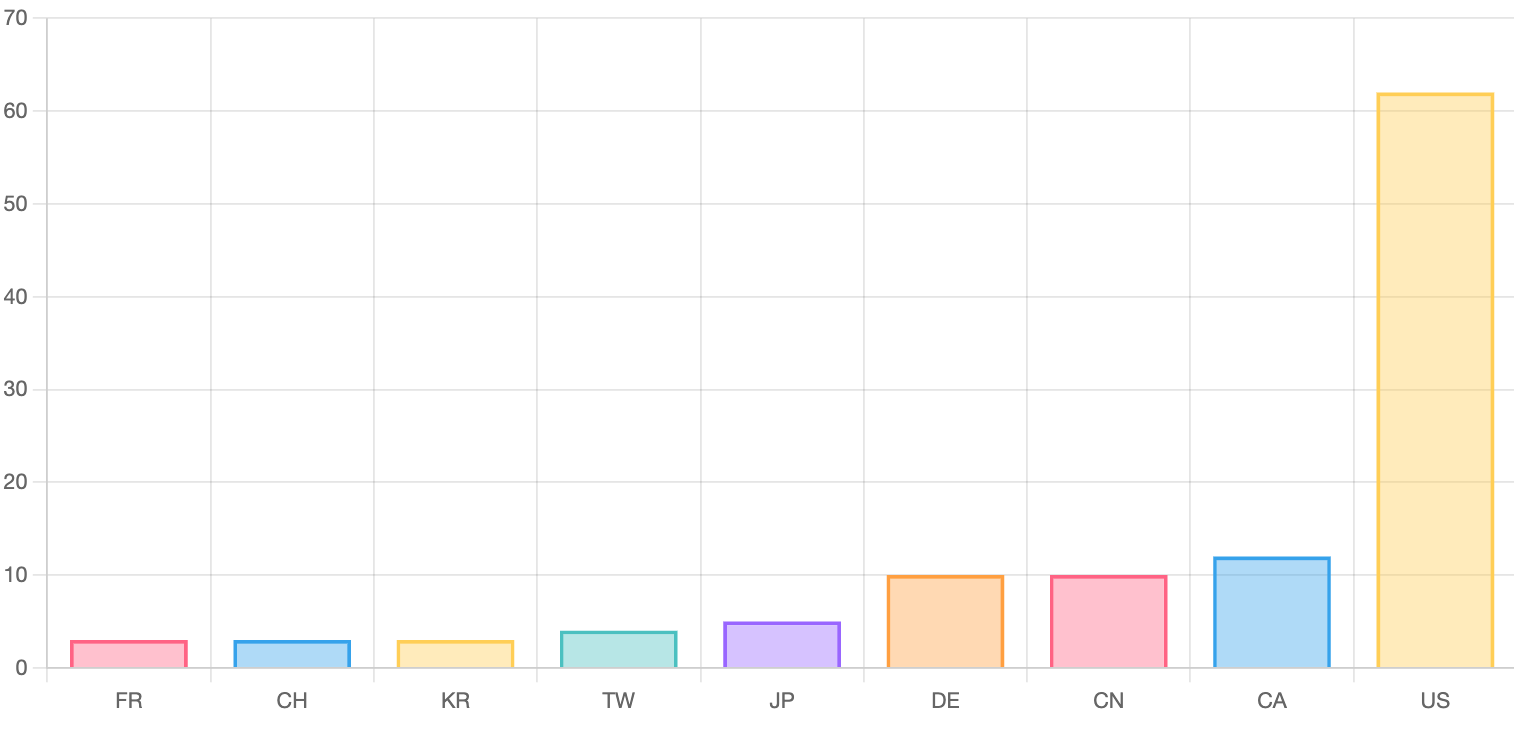
In this assignment, you will practice with Higher-Order Functions (e.g., map, filter, and reduce...) and with an external library (Chart.js). The application lets a user visualize a dataset with the papers published at the UIST conference between the year 2010 and 2021, similarly to this website.
Furthermore, you will be using Vite for development, and, as usual, you will have to make commits and branches in git.
Getting started with Vite and the code stubs
The files index.html and main.js contain a minimal stub to get you started.
To start developing, open the terminal and type once
npm install
to install all the dependencies. Then type
npm run dev
to start the local server on port 3000.
Requirments
- You cannot use loops (while, for, forEach) throughout the assignment. Use instead
map,filter,reduce, etc... - You have to implement your simple UI interface using either HTML code (
<button>,<input>...).
Overview
The homework is conceptually split into two parts: 1) extracting information from the dataset (data-mining), and 2) visualizing the information on the graph.
1. Mining the data
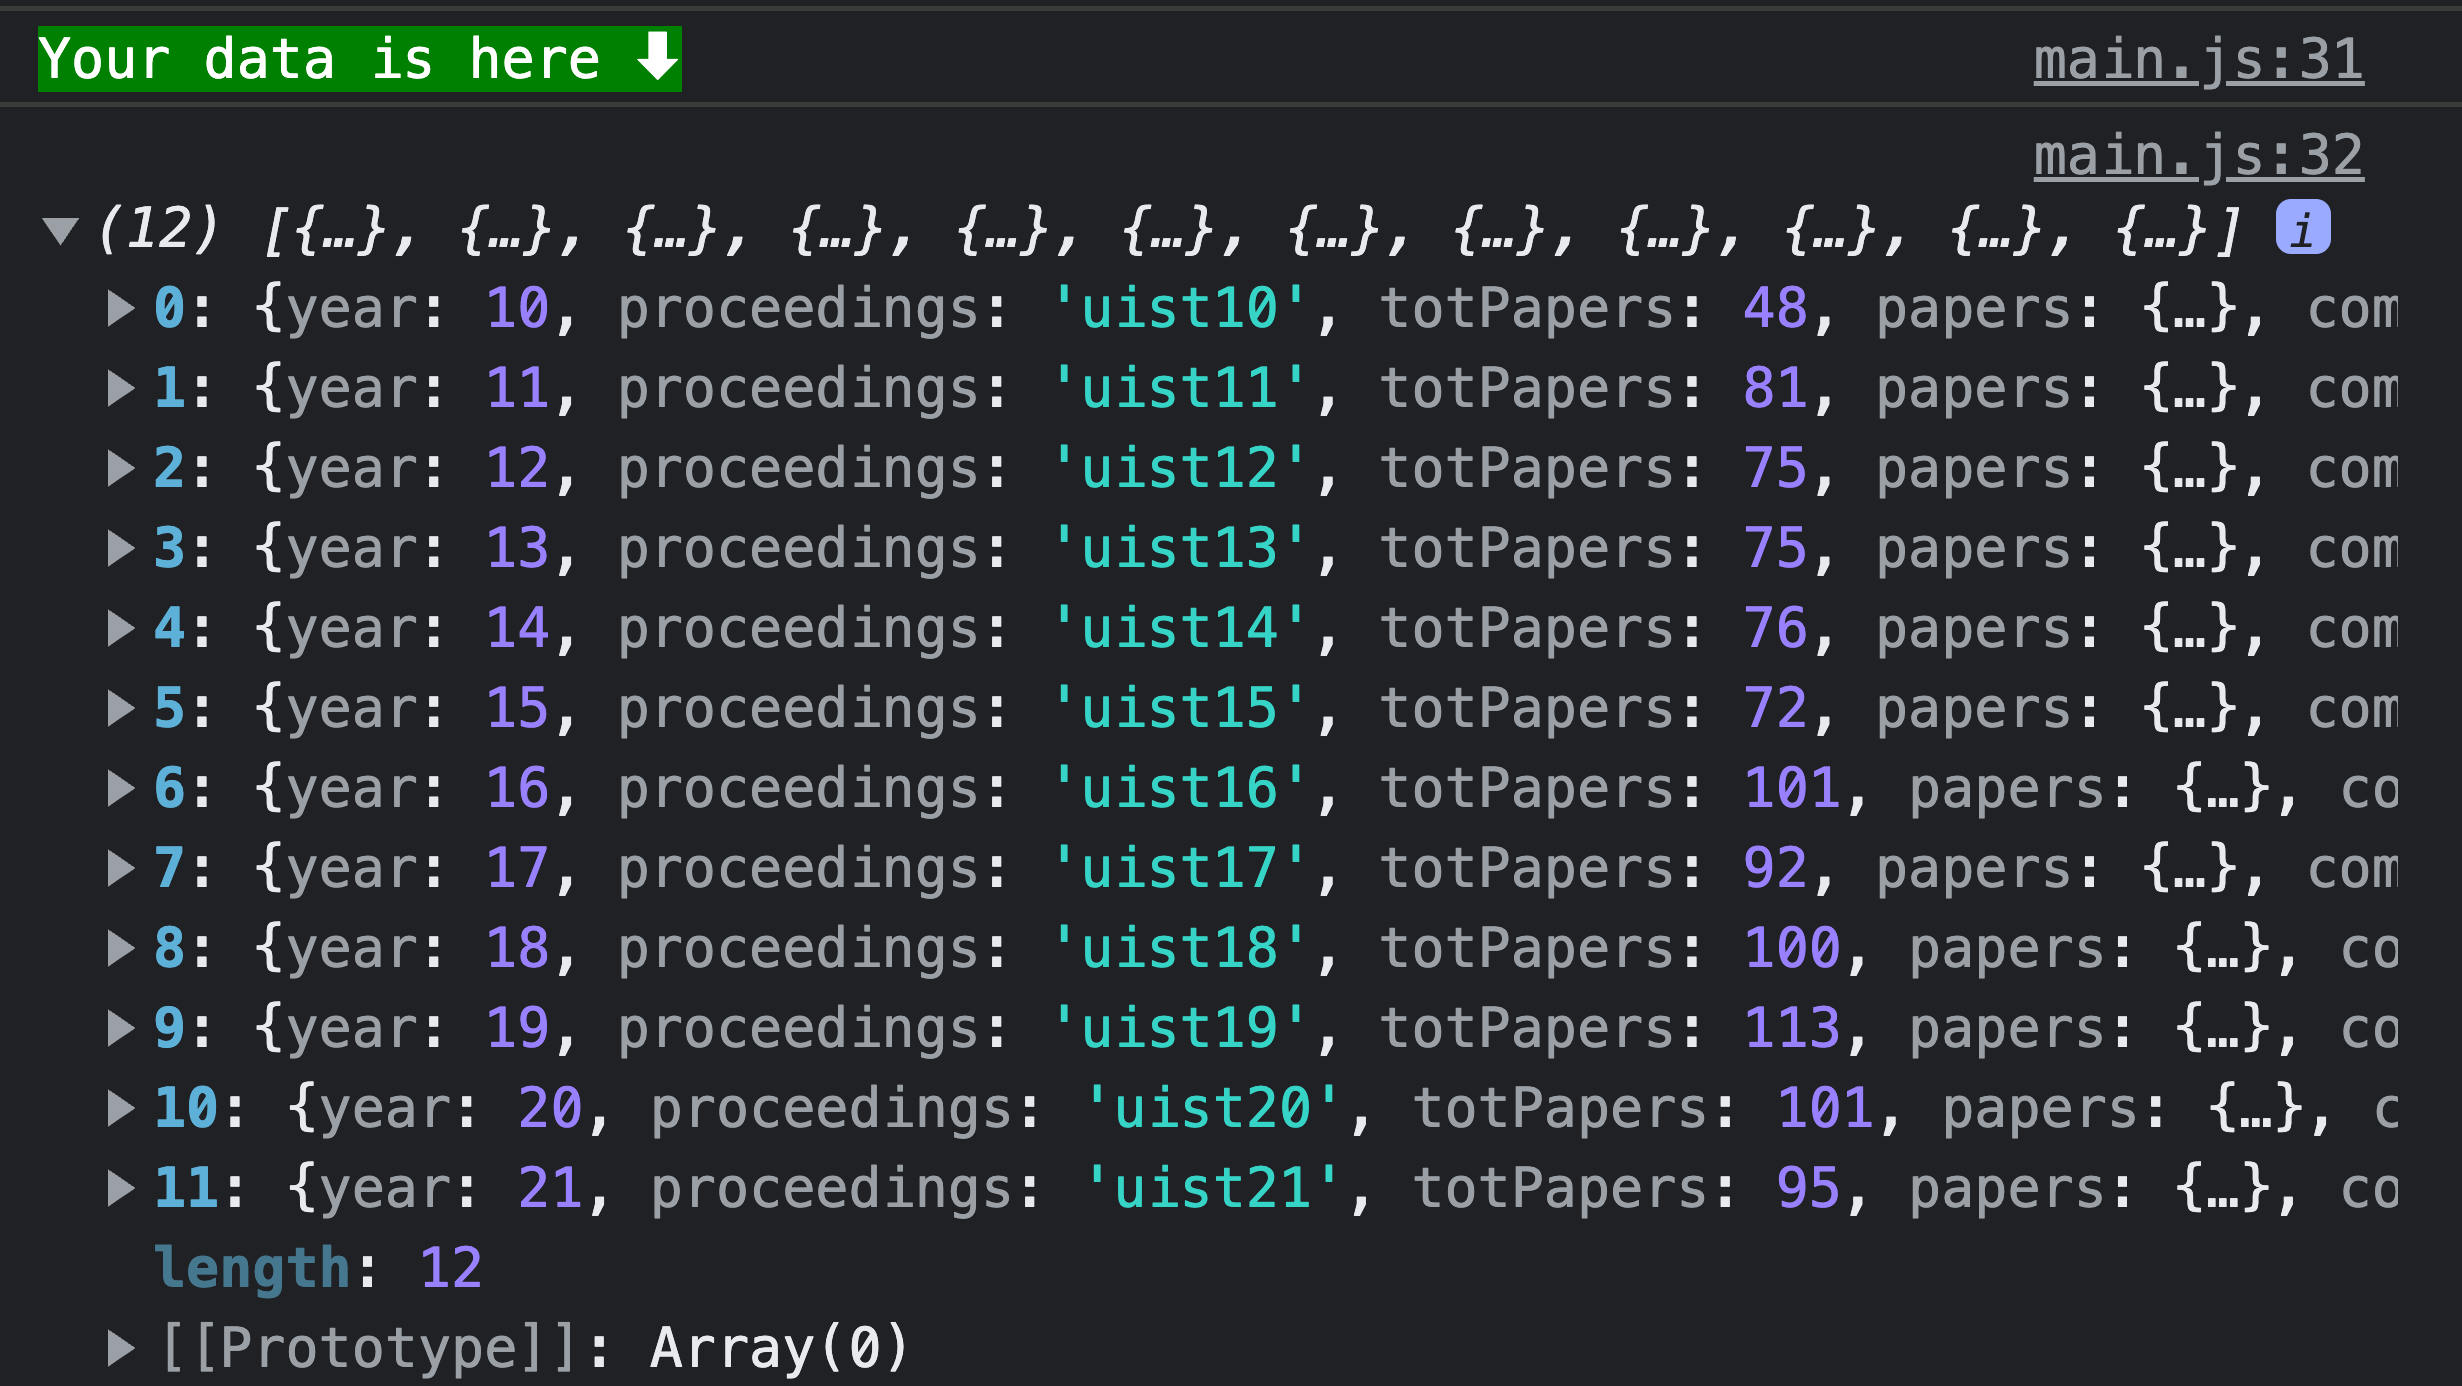
The dataset is imported with the line import data from './data.json' at the top of the main.js. Note that the ability to load files with import statements is only possible with a tool like Vite.js. When you start, you should see the data printed in the console like below:
Before starting, you will have to implement your GUI with the buttons, sliders, input fields, and dropdown boxes as in the picture below. Styling the UI is optional.
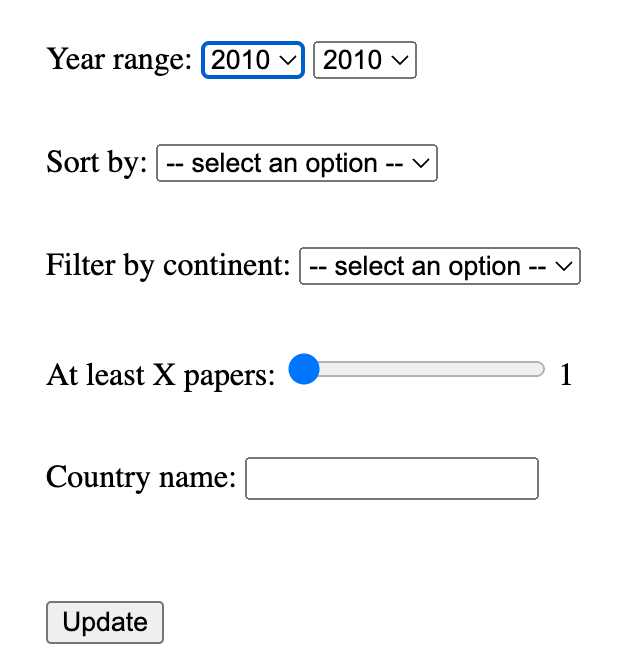
- Two dropdown box with start and end years (2010 <= year <= 2021)
- One dropdown box with sorting options:
- Sorting by country name in alphabetical order (A to Z)
- Sorting by country name in reversed alphabetical order (Z to A)
- Sorting by number of papers in ascending (low to high) order
- Sorting by number of papers in descending (high to low) order
- One dropdown box with continent names (Africa: AF, Asia: AS, Europe: EU, North America: NA, South America: SA, Oceania: OC)
- A slider with the threshold of minim number of papers (from 1 to 600).
- An input box that allows entering the name of a country. Partial entries are acceptable. For example, if I type 'A' I can see 'CA, AU, AR' (Canada, Australia, Argentina).
- An update button for updating the graph with the new filters.
Once the interface is working, you need to implement all the filtering:
- by year: a single year or a range can be selected. If the start year is greater than the end year, internally swap them so that it still works.
- by name (AZ, ZA)
- by number of papers (high to low, or vice-versa)
- by continent of the country of origin
- with at least X amount of papers
- by country name (input by the user)
Please test the demo to see details. Remember that YOU ARE NOT ALLOWED TO USE ANY LOOP and you can only use Higher-Order Functions to iterate the data.
The graph is updated only once the button update is clicked.
2. The graph
To draw on the graph, please refer to the documentation of Graph.js. The file main.js contains already something to get you started.
To update your graph do somethign like this:
chart.data.labels = new_labels_array;
chart.data.datasets[0].data = new_dataset_array;
chart.update();
where new_labels_array is an array of strings (the labels), and new_dataset_array is an array of numbers that will be displayed in the graph. Remember to call the update method to see the result!
About grading
The maximum score of this assignment is 100 points, divide in this way:
- Git: Submit your local repository with your code (the hidden .git folder). There should be at least 10 commits in a branch called
develop(that you have to create), which is finally merged back tomain(10%). - The graphical user interface (input controllers and output text) is working (10%)
- The graph is updating and drawing something (20%)
- The six filtering functionalities (60%, each counted 10%)
- Bonus points (5%) are given for styling the UI in CSS.
- No loops! (penalty given)
If the program does not compile (e.g., not valid javascript file) the score is 0. If it runs, the score is inversely proportional to the number of errors. If the code has runtime errors (crash), there is a 20 points penalty, plus a penalty for any additional part that cannot be checked.
How to submit
- After completing your code, make sure to fill out the Submission Notes with your basic info and indicate whether you received any help. Feel free to add any relevant information.
- Zip the folder of this repository containing your solution.
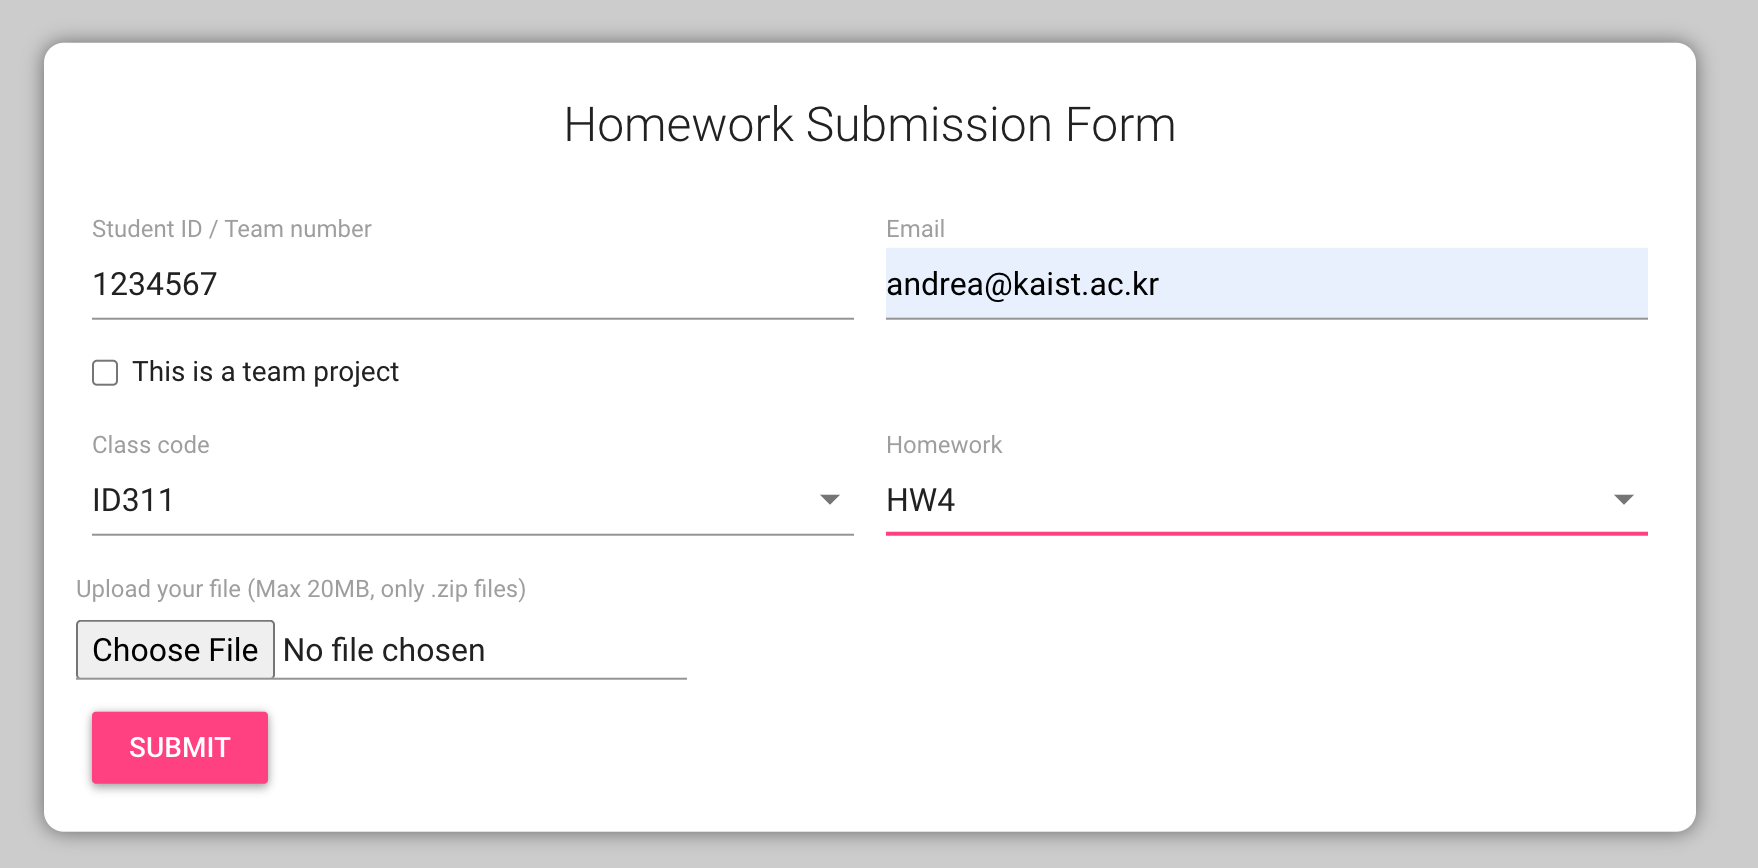
- Submit the homework using the class submission system. Choose
HW4. - For any problems, feel free to contact the professor or TA via Discord.
NOTES
- Only submissions made through the system will be considered (e.g., no direct emails to the TA or Prof).
- You can resubmit as many times as you want; only the last submission will be considered.
- Submissions after the deadline (even a few minutes) will receive a penalty of 20%. Submissions made after 24 hours from the deadline will be ignored (score will be 0).
- Keep a screenshot that proves your completed submission.
- Coding style may be considered in grading.